
MCX Chart Analysis: Tools You Must Know
Chart analysis is a crucial skill for every commodity trader on MCX (Multi Commodity Exchange of India). Whether you’re trading gold, crude oil, or metals, understanding how to analyze charts can help you identify trends, set entry and exit points, and improve your overall trading strategy.
In this guide, we’ll explore the must-know tools for MCX chart analysis and how to use them effectively.
Why Chart Analysis Matters in MCX Trading
- Visual insight into price movements
- Helps identify support, resistance, and trends
- Confirms buy/sell signals using indicators
- Suitable for both intraday and positional trading
- Enhances risk management through stop-loss planning
✅ Top Tools for MCX Chart Analysis
1. TradingView (via Brokers)
Overview:
TradingView is the most popular charting tool used globally. Many Indian brokers integrate it directly into their platforms (Zerodha, Angel One, Upstox).
Key Features:
- Real-time MCX charts
- 100+ built-in indicators (RSI, MACD, Bollinger Bands)
- Drawing tools for trendlines, Fibs, etc.
- Multiple timeframes (1 min to monthly)
- Custom layouts and watchlists
Best for:
Intraday traders, technical analysts, beginners to pros
2. Zerodha Kite Charts
Overview:
Zerodha’s platform offers built-in charting powered by ChartIQ and TradingView.
Features:
- Easy access to MCX charts from the app or web
- Supports indicator overlays
- Order placement from charts
- Compare multiple commodities on the same screen
Best for:
Zerodha users who need seamless trade + chart integration
3. Upstox Pro Charts
Overview:
Upstox provides professional-grade charts with a clean interface.
Features:
- Multiple charts on one screen
- Indicator stacking
- Interactive chart trading
- Candlestick and Heikin Ashi views
Best for:
Speed-focused traders using mobile or desktop
4. FYERS Web & App Charts
Overview:
FYERS offers advanced charting with full TradingView integration.
Features:
- 60+ indicators
- Templates for strategies
- Price alerts
- Heatmaps and sector analysis
Best for:
Advanced traders and swing traders needing visual tools
5. Spider Software (Premium Desktop Tool)
Overview:
A professional tool for commodity traders with extensive analysis features.
Features:
- Tick-by-tick MCX data
- Proprietary signals
- Custom backtesting
- High-speed scanning
Best for:
Professional traders and brokers
6. Investing.com & Moneycontrol
Overview:
Good for beginners and mobile chart viewing.
Features:
- Basic charts
- Key technical levels
- Analyst recommendations
- Mobile-friendly
Best for:
Quick reference, market overviews
Essential Chart Types for MCX Traders
- Candlestick Charts: Show price action, reversals, and patterns
- Line Charts: Simple, good for beginners
- Bar Charts: Offer open-close-high-low data
- Heikin Ashi: Smoother trends for swing trading
Key Indicators to Use on MCX Charts
| Indicator | Purpose |
|---|---|
| Moving Averages (MA, EMA) | Identify trend direction and momentum |
| RSI (Relative Strength Index) | Detect overbought/oversold conditions |
| MACD | Spot trend reversals and momentum shifts |
| Bollinger Bands | Measure volatility and breakout zones |
| Volume | Confirm price action with trading volume |
FAQs
What is the best free chart tool for MCX trading?
TradingView (via your broker) is the best free tool with real-time MCX charts and indicators.
Can I trade directly from MCX charts?
Yes, most broker platforms allow chart-based trading where you can place, modify, or cancel orders from the chart window.
Do MCX charts update in real time?
Yes, broker platforms provide real-time chart updates for active MCX contracts.
Which timeframe is best for intraday MCX trading?
5-minute and 15-minute charts are commonly used for intraday commodity trades.
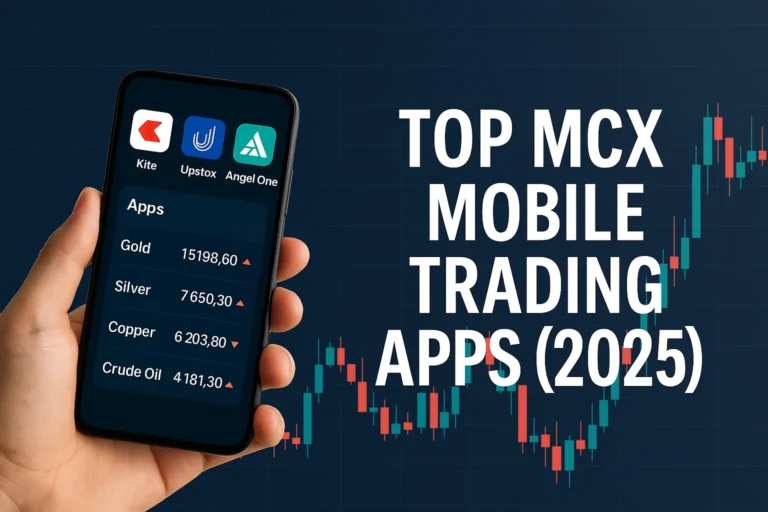
Is charting available on mobile apps?
Yes, apps like Kite, Angel One, and Upstox support full-featured charting on mobile devices.