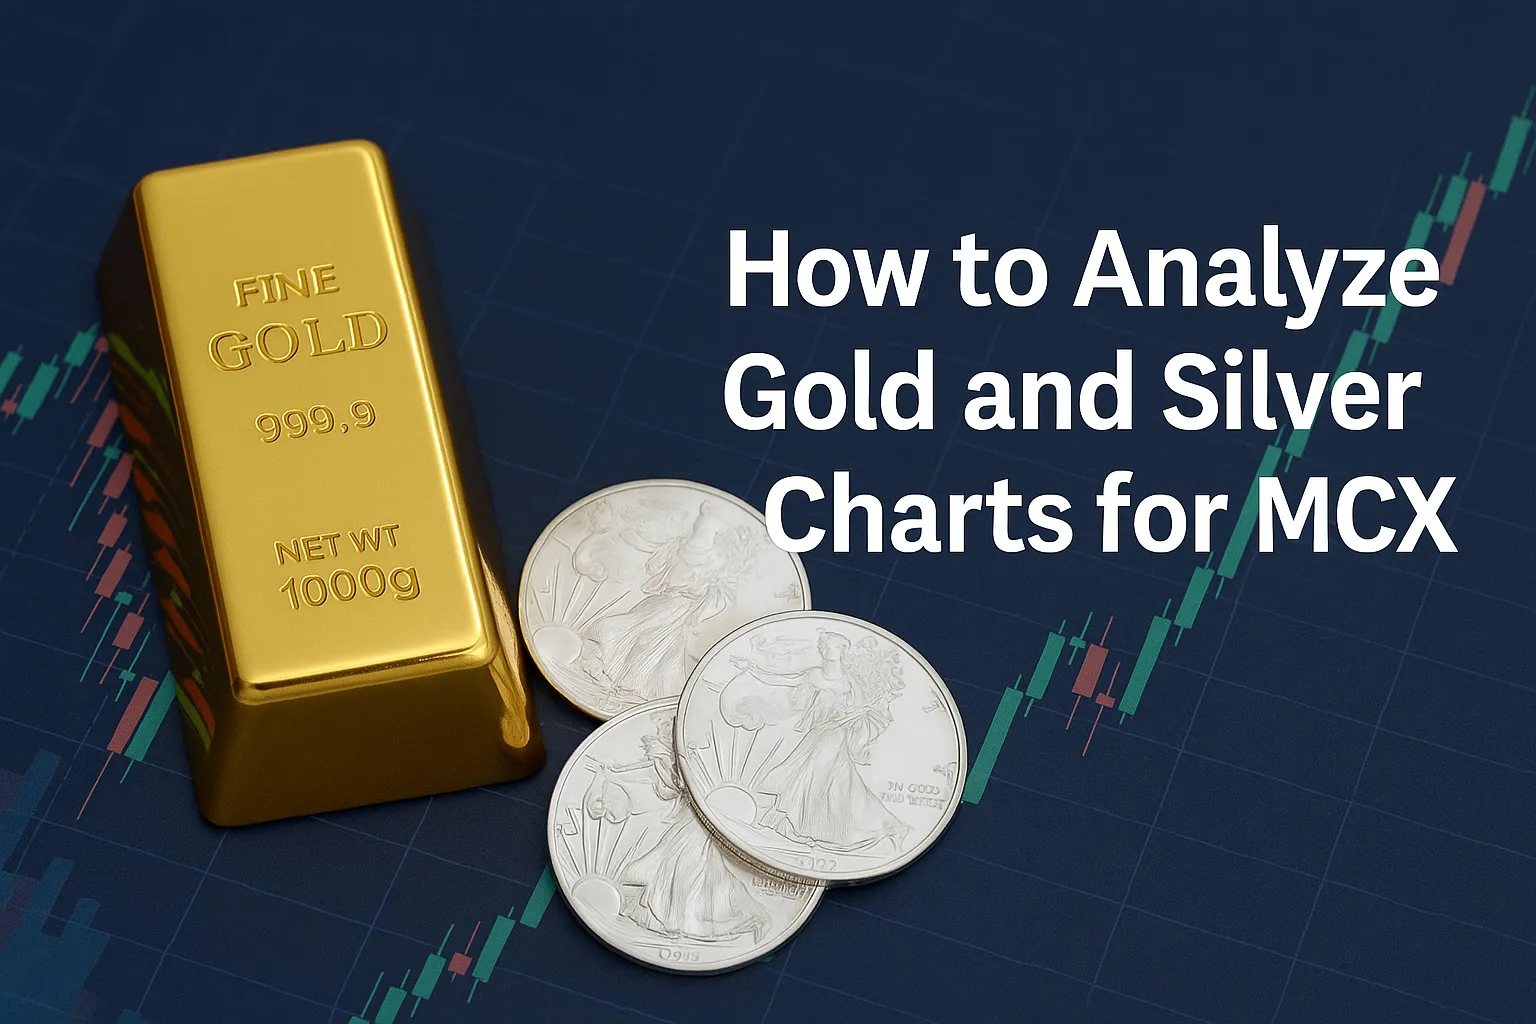
How to Analyze Gold and Silver Charts for MCX
Gold and silver are two of the most heavily traded commodities on MCX (Multi Commodity Exchange) in India. Their high liquidity and price sensitivity make them ideal for both intraday and swing traders. However, making informed decisions requires proper chart analysis.
In this guide, you’ll learn how to analyze MCX gold and silver charts using proven technical tools and chart-reading methods suited for Indian traders.
Why Analyze Gold and Silver Charts?
- Understand price trends and momentum
- Identify entry and exit points
- Spot key support and resistance levels
- Avoid emotional or impulsive trades
- Plan intraday and positional strategies effectively
Recommended Timeframes
| Trading Style | Chart Timeframe |
|---|---|
| Intraday | 5-min, 15-min |
| Swing Trading | 1-hour, 4-hour |
| Positional | Daily, Weekly |
Use multiple timeframes for confirmation.
Step-by-Step: Analyzing Gold & Silver Charts on MCX
1. Identify the Trend Using Moving Averages
Use:
- 20 EMA and 50 EMA for short- to mid-term trends
- 200 EMA for long-term trend guidance
Tip:
- When 20 EMA > 50 EMA, look for long trades
- When 20 EMA < 50 EMA, look for short trades
2. Draw Support and Resistance Levels
Manually mark horizontal levels on charts where:
- Price repeatedly reverses or pauses
- Previous swing highs and lows occur
These are key zones for potential bounce or breakout.
3. Use RSI to Detect Overbought/Oversold Conditions
- RSI above 70 = overbought (potential reversal down)
- RSI below 30 = oversold (potential reversal up)
Tip: Combine with price action at support/resistance for higher accuracy.
4. Watch for Candlestick Patterns
Look for these common patterns:
- Bullish Engulfing (reversal up)
- Bearish Engulfing (reversal down)
- Doji (indecision or reversal near key levels)
- Hammer/Inverted Hammer
These patterns become more powerful near support/resistance.
5. Check Volume Confirmation
- Rising volume during a breakout = strength
- Low volume during reversal = caution
Use volume to confirm breakout or trend continuation.
6. Monitor Global Gold/Silver Prices
MCX gold and silver are influenced by:
- COMEX prices
- US Dollar Index (DXY)
- Geopolitical news and inflation data
Use TradingView to compare global vs MCX charts.
Practical Tools to Use
- Zerodha Kite / Angel One (with TradingView charts)
- Investing.com for global price tracking
- MCX India for contract and price data
- TradingView India with free gold/silver chart access
Common Mistakes to Avoid
- Trading based on news without chart confirmation
- Ignoring global cues affecting precious metals
- Using too many indicators at once
- Chasing breakouts without confirmation
FAQs
Can beginners analyze gold and silver charts?
Yes. Start with basic tools like moving averages, RSI, and support/resistance. Avoid complex indicators initially.
Do MCX and global gold prices match?
Not exactly. MCX prices are INR-based and include currency impact and taxes, but they follow global trends closely.
Which indicator is best for gold?
RSI, Moving Averages, and Bollinger Bands are widely used for gold due to its volatility.
Are gold charts the same as silver charts?
While techniques are similar, silver tends to be more volatile and less stable than gold, requiring tighter stops.
Can I analyze gold/silver on mobile apps?
Yes. Most broker apps and TradingView mobile apps support full-featured charting with indicators.


